Category: Charts and Graphs

CLAD 04-14

CLAD 04-14

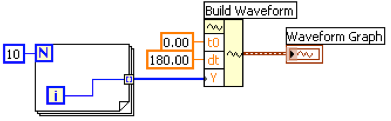
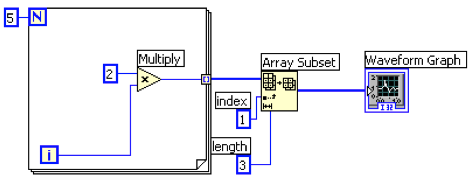
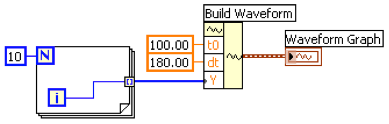
Which of the graphs below matches the output in the Waveform Graph indicator after the following code has executed?

CLAD 04-13

CLAD 04-13

Which of the following produces this XY Graph?

CLAD 03-37

CLAD 03-37

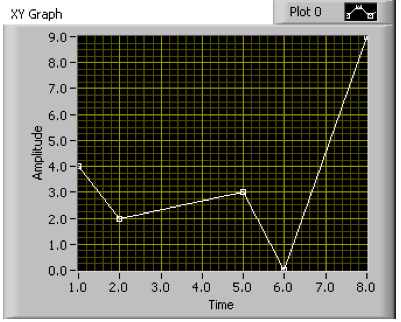
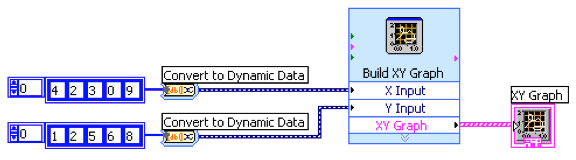
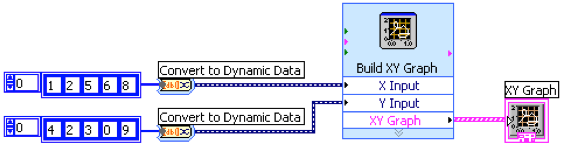
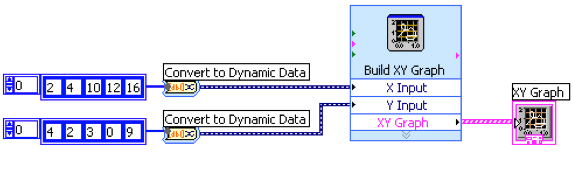
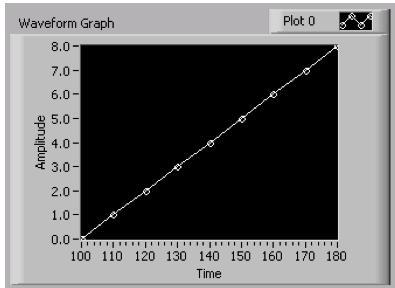
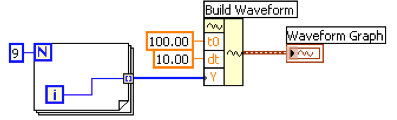
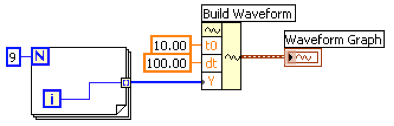
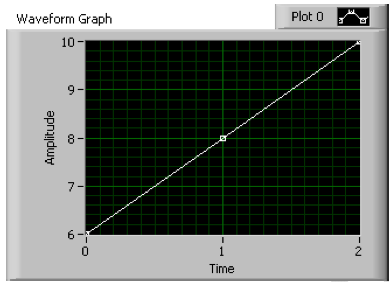
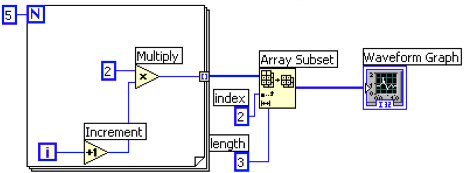
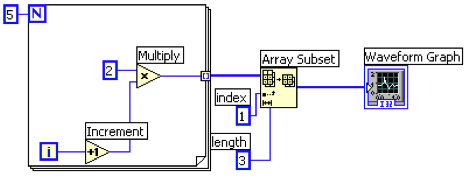
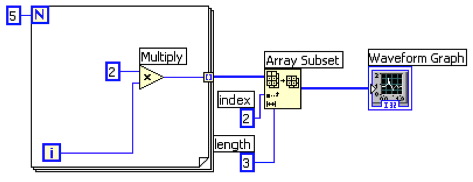
Which of the following Block Diagrams could produce this result in Waveform Graph?

CLAD 03-36

CLAD 03-36

Which block diagram would generate the following front panel?

CLAD 04-12

CLAD 01-38

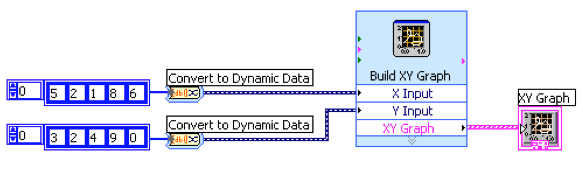
Which of the following allows you to plot any set of points, evenly distributed or not?

  1. Waveform Graph
  2. Waveform Chart
  3. XY Graph
  4. Both A and C

CLAD 03-23

CLAD 03-23

Which Chart update mode should be used to draw new data from left to right, then clear the chart and draw new data again from left to right?

  1. Strip Chart
  2. Scope Chart
  3. Sweep Chart
  4. Step Chart

CLAD 03-18

CLAD 03-18

Which combination of words correctly completes the following statement?

Unlike ________________, which display an entire waveform that overwrites the data already stored, _____________ update periodically and maintain a history of the data previously stored.

  1. Graphs; Charts
  2. Charts; Plots
  3. Plots; Graphs
  4. Charts; Graphs

CLAD 02-33

CLAD 02-33

Which chart update mode should be used to compare old and new data separated by a vertical line? This chart will display similar to an electro-cardiogram (EKG).

  1. Strip Chart
  2. Scope Chart
  3. Sweep Chart
  4. Step Chart

CLAD 02-21

CLAD 02-21

Which of the following will allow you to have multiple plots on a Waveform Graph?

  1. Bundle two 1D arrays of X and Y data together for each plot. Then build an array of these clusters and wire it to the Waveform Graph indicator.
  2. Build a 2D array of data with each plot in a separate row (or column) oin the array, then wire the array to the Waveform Graph indicator.
  3. Bundle the elements of each waveform into a cluster and build an array of these clusters, then wire the array to the Waveform Graph indicator.
  4. Both B and C.

CLAD 01-38

CLAD 01-38

Which of the following methods will crewe an XY Graph with two plots?

  1. Create a single cluster from two arrays of X values and two arrays of Y values in an X,Y,X,Y pattern.
  2. Bundle the X and Y array pairs together into two clusters and then create an array of these two clusters.
  3. Bundle the X and Y array pairs together into two clusters and create a cluster of these two clusters.
  4. Create a single array of each of the X arrays and Y arrays in an X,Y,X,Y pattern.
Top