![]()
About Physics Data Assistant
Physics Data Assistant is an easy to use graphing and curve fitting application. While originally created for use in the WKU University Physics Laboratories, you may find it useful in other fields where you have to plot data and fit to a variety of different mathematical models.
Creating a publication quality graph is performed in easy steps of loading (or editing) your data, plotting your data, fitting it to a model, and exporting it to a file or the clipboard.
This software is installed on the computers in the WKU University Physics Laboratory, but you can also easily install it on your own computer by using the download links and instructions provided below. The program is written in LabVIEW and requires the LabVIEW Run-Time Engine to operate properly. The Windows installer will install both Physics Data Assistant and the LabVIEW Run-Time Engine. However, these are two separate steps on the Macintosh as described below. If you have to reinstall an updated version of Physics Data Assistant on an Apple computer, you do not have to reinstall the run-time engine.
| Platform | Installation Instructions | |
 |
Windows
|
 Version 1.3.0 |
 |
Apple MacintoshUnfortunately, it has become impossible to continue to maintain installers for Physics Data Assistant on the latest versions of MacOS. If you have a relatively new Mac and cannot install Physics Data Assistant using the provided installer below, then you can instead run the software on the WKU App Streaming platform at appstream.wku.edu.
After navigating to appstream.wku.edu you will be given the choice to start the app streaming service by installing the Horizon VMware client or by using the HTML version in your browser. Installing the Horizon VMware client offers much better performance. Some knowledgebase articles for using WKU App Streaming: If you have an older MacOS (Ventura or earlier), then you can use the instructions below to install version 1.2.7 on your Macintosh.
If you run into any issues during installation of either the LabVIEW Run-Time Engine or with Physics Data Assistant on the Macintosh please check out the Frequently Asked Questions section below. |
 Version 1.2.7  |
Instructional Videos
| About Physics Data Assistant | Installing on Windows |
| Installing on Macintosh | Working with Data |
| Graphing Data | Fitting Linear Data |
| Fitting Nonlinear Data | Exporting Graph as Image |
Known Bugs
- None at this time as of version 1.2.8. If you encounter an issue with Physics Data Assistant please forward a description of the problem along with a screenshot to Doug Harper.
Version History
| Version | Date | Description |
| 1.3.0 | August 24, 2025 | Updated the codebase to LabVIEW 2025 Q3 and built a new executable that would be compatible with Windows 11 24H2. [Win] |
| 1.2.8 | December 7, 2022 | Corrected an error in the units displayed for angular frequency in a sinusoidal fit. [Win] |
| 1.2.7 | July 12, 2021 | Corrected some formatting issues in the Mean and Standard Error Tool that occurred when the standard error was zero. [Win] [Mac] |
| 1.2.6 | July 11, 2021 | Made some additional changes in sub panel sizes to ensure that there were no problems running on a computer with 2560 x1600 resolution with 200% text size scaling. This is effectively a 1280 x 800 resolution but the actual window size is smaller than normal due to the bottom menu bar and the text scaling. [Win] |
| 1.2.5 | July 4, 2021 | Corrected some special character formatting issues in the mean and standard error tool on the Mac version. |
| 1.2.4 | July 3, 2021 | Modified the mean and standard error tool to display information for the one- and two-standard error confidence intervals. [Win] |
| 1.2.3 | June 18, 2021 | Fixed an error that was causing the Graph Title and Axes Labels to not properly update on the sub panel editor when an experiment was opened or when a new experiment was created. |
| 1.2.2 | June 17, 2021 |
Modified the manner in which annotations were stored internally in order to allow the program to always remember the position of the annotations when the graph is redrawn. Previously, annotations that had been dragged to a new position were redrawn incorrectly at their initial position. Modified the initial position of floating annotations so that by default they will appear in the center of the graph. Previously they always appeared initially at coordinates of [0, 0] and depending on the X- and Y-scales this point may not have been visible in which case the annotation did not appear. |
| 1.2.1 | June 4, 2021 |
Added a new tool for calculating the mean and standard error of a set of numerical values. The results can be computed based upon sample or population statistics. [Win] [Mac] |
| 1.2.0 | June 3, 2021 |
Added the ability to be able to save an entire experiment consisting of data, multiple plots on a single graph, and all graph properties and annotations. The previous File: Open and File Save operations which only operated on the data, are now moved to a new menu called Data which has Import Data and Export Data options. With this new approach multiple data files can now be loaded into one single experiment. Corrected an issue where graphs had a yellow background when exported on the Mac version of the application. Corrected an issue where an Error 43 was generated when the user cancelled a File Save operation at the file dialog. Corrected a problem that occurred when the number of points in the X and Y waveforms in a fit were not equal. Now, the extra points in the longer waveform will be ignored. |
| 1.1.6 | January 22, 2021 | Added a Statistics subPanel that displays the minimum, maximum, average, standard deviation, and slope for either the entire waveform or for the data between the cursors. Cleaned up some issues with communication between subPanels that was necessary when the user moved the cursors. [Win] [Mac] |
| 1.1.5 | January 21, 2021 | Corrected a bug where an extra “s” was printed following each column of data as the data was exported to a tab-delimited text file. The format specifier was “%gs” instead of “%g” causing this issue. Added the ability to Insert a data point into the data table or to Delete a point from the data table via a Right-Click pop-up menu option. |
| 1.1.4 | January 3, 2021 | Cleaned up the Cursor Legend display which wasn’t properly showing the names of the current plots. The Cursor Legend control is now only available when the cursors are visible on the plots. Also added a control to allow the user to show or hide plot visibility checkboxes on the plot legend. [Win] [Mac] |
| 1.1.3 | January 2, 2021 | Modified the exponential fit to use the equation A*exp(-x/B) + C. Made the graph title and axes labels larger by changing the font size from H2 to H1 and the changed the axes numbers from H3 to H2. Changed the polynomial fit routine to use the General Linear Fit VI which provides the covariance matrix which will allow computation of the fit uncertainties. |
| 1.1.2 | September 13, 2020 | Updated the codebase to LabVIEW 2020. Added ability to perform exponential, power law, and gaussian function fits. Also, added a special fit function for the Power Transfer experiment in the University Physics II Laboratory. [Win] [Mac] |
| 1.1.1 | February 6, 2020 | Corrected a bug in the fit editor that occurred when an existing fit was selected for editing. Disabled several right-click shortcut options on the main graph control in order to not conflict with the built-in annotations and graph properties editor. |
| 1.1.0 | January 23, 2020 | Cleaned up some typos on the information tab. This is the version that will be installed on WKU Physics and Astronomy computers for the Spring 2020 semester. [Win] [Mac] |
| 1.0.9 | January 23, 2020 | Finished the Application Information tab which provides easy access to basic help for using the program. Added buttons New File, Open File, and Save File to the Edit Data tab for easier access to these functions instead of having to use the File menu. [Win] [Mac] |
| 1.0.8 | January 21, 2020 | Made improvements to the annotation feature including allowing Free (or Floating) annotations, specifying which point the annotation will attach to, and allowing user to choose whether or not an arrow is drawn from the annotation to a point. Trapped the error that occurred when a non-linear fit didn’t converge because of bad guesses and warned the user to improve the guesses and try again. Corrected an issue that was occurring on startup and shutdown on the Mac platform when the program was trying to access the Support directory inside the application to set and retrieve the screen coordinates of the app window. [Win] [Mac] |
| 1.0.7 | January 20, 2020 | Added the ability to annotate graphs. [Win] [Mac] |
| 1.0.6 | January 12, 2020 |
Added code to maximize the window on the first run of the program and then to save the screen location between runs so that subsequent runs will start in the same screen location and size as when the program was last quit. Made some additional adjustments to make sure that the program would play nicely with window sizes as small as 1280 x 800 on both Windows and Mac platforms. Did some cleaning up of font size differences on Mac and Windows platforms. Added the ability to show or hide the plot legend in the upper right corner of the graph. Implemented an improved scheme to send messages from the user interface to the sub panels. Added an error handler system to inform the user of any errors. |
| 1.0.5 | January 12, 2020 | Made the plot engine use the same color for plots, guesses, and fits that correspond to a particular dependent variable. Corrected some issues with editor panes showing incorrect information at certain circumstances. Added the ability to save data to a tab-delimited text file. If the file was originally loaded as a CSV file it will continue to save in that format. Modified the fitting engine to automatically show cursors on a graph if the user selects the option to Fit the Data Between the Cursors. [Win] [Mac] |
| 1.0.4 | January 11, 2020 | Improved to logo on the About screen and the program icon. |
| 1.0.3 | January 11, 2020 | Finished the code for performing Sinusoidal and Underdamped Oscillator model fits. Disabled the ability to select the other types of fits that are not completed yet. These include Power Law, Exponential, Gaussian, and Custom. |
| 1.0.2 | January 9, 2020 | Finished the code for computing the guesses for all the different fit types except a Custom fit. Corrected an error where the slope and intercept were interchanged in the display equation for a linear fit. Created the first MacOS application. [Win] [Mac] |
| 1.0.1 | January 8, 2020 | Reduced the minimum screen size of the application to attempt to accommodate monitor resolutions with as small as 800 vertical pixels. Added this About dialog to keep track of version history. Added the ability to copy the fit results to the system clipboard. Corrected a bug where the graph wasn’t cleared when a new data file was loaded. |
| 1.0.0 | January 7, 2020 | Initial release for testing during development. |
Frequently Asked Questions
Physics Data Assistant is presently developed (as of January 2020) in LabVIEW 2019 SP1. This version of LabVIEW has a run-time engine that has been certified and tested by National Instruments in Mac OS 10.13 (High Sierra) and 10.14 (Mojave), but we have found it to work well from Yosemite to Catalina.
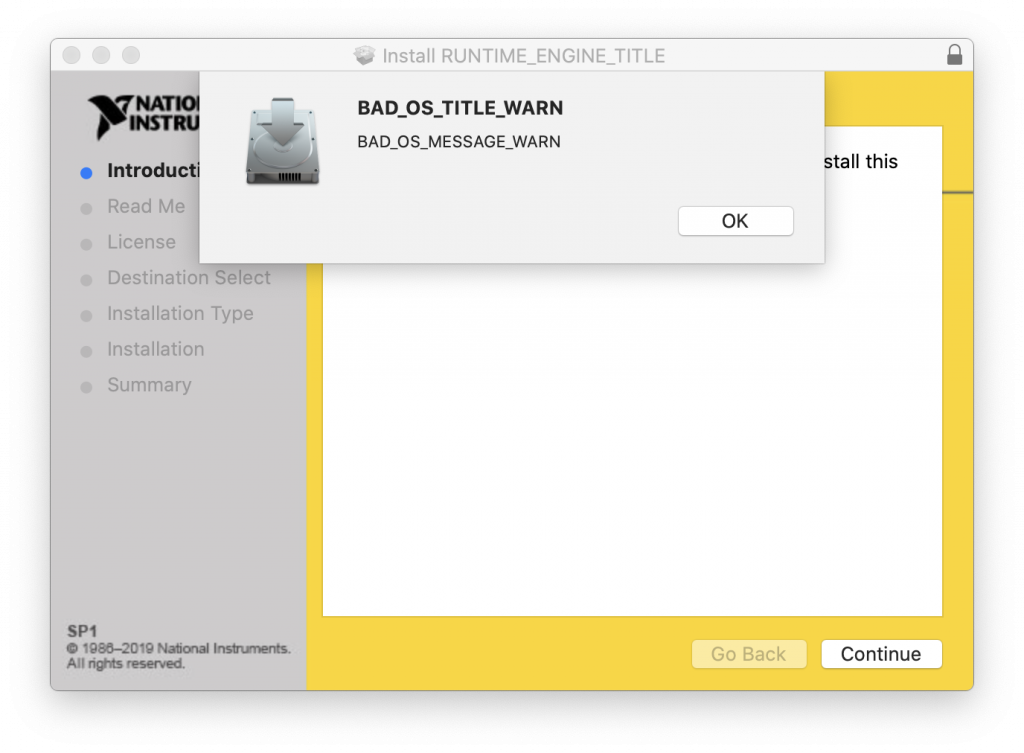
We have noticed that in Mac OS 10.15 (Catalina) that this warning message may appear during installation. However, you can safely ignore the message and continue with the installation. After pressing OK, the installation of the LabVIEW Run-Time Engine should continue with no issue.
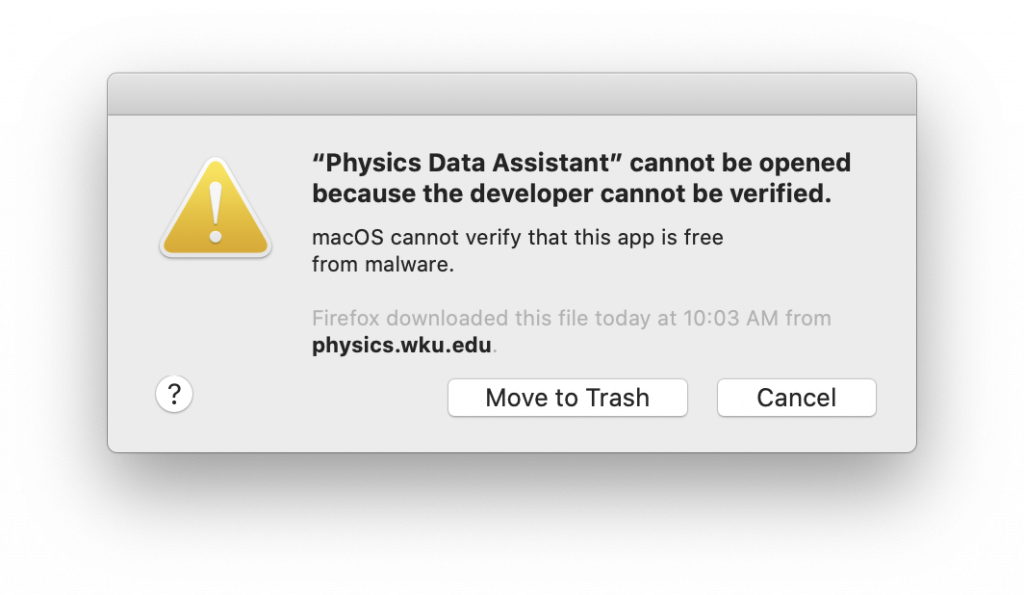
Depending on your settings, this is very likely to happen the first time you attempt to run Physics Data Assistant on the Macintosh. Apple very aggressively warns about using software that is has not reviewed.
To get past this warning there are two possible approaches.
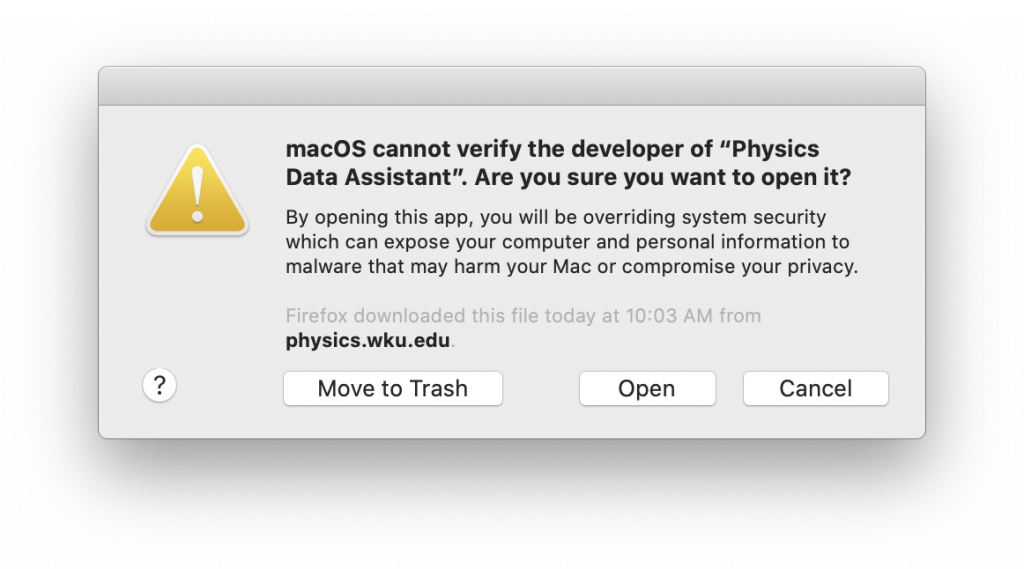
First, you can right-click on the program in the Applications folder and select Open from the pop-up menu that results. Then, the resulting dialog box you will receive will contain an extra button that will allow you to Open the software anyway.
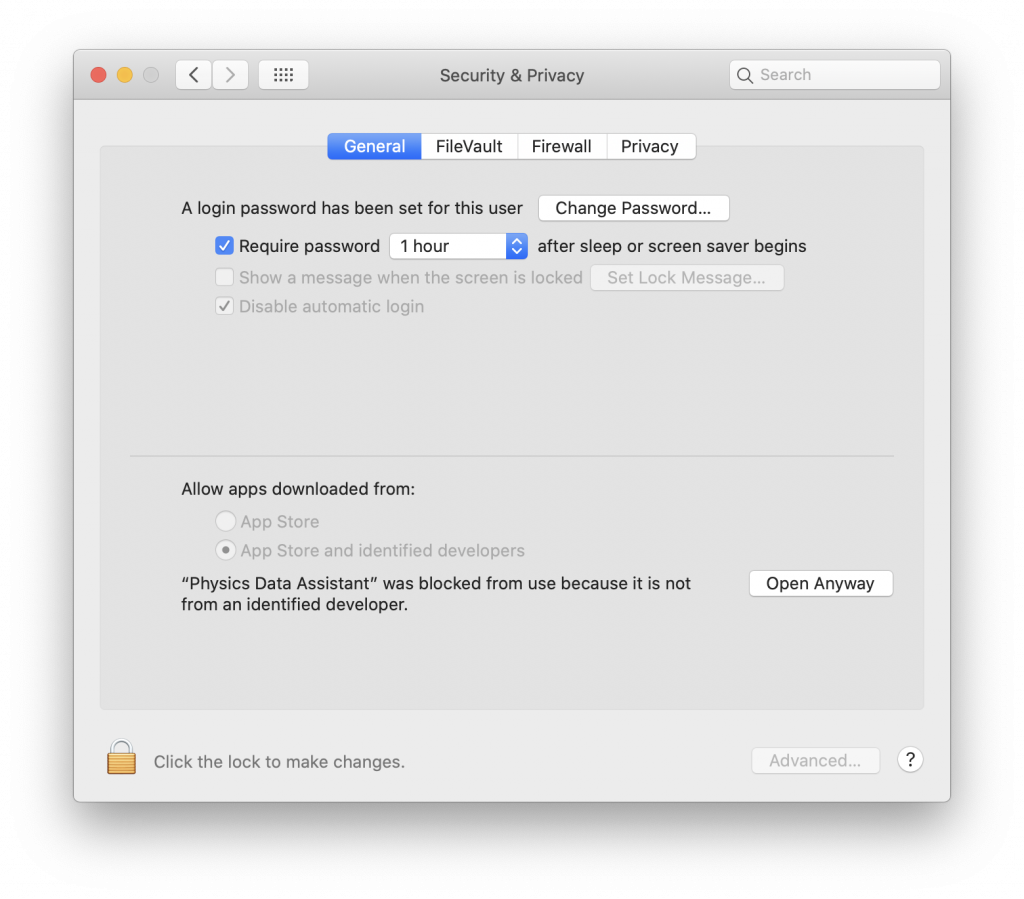
Another approach, is to go to the Security & Privacy section of the System Preferences. On the General tab you will notice that there is the Open Anyway the “Physics Data Assistant” program.