WKU Surface Analysis Laboratory


gdaes.jpg (14615 bytes)

Glow discharge-atomic emission spectroscopy (GD-AES) is an analytical technique which can provide a rapid and accurate description of the surface and bulk elemental composition of a wide variety of materials. In GD-AES analysis the sample is exposed to an argon plasma which uniformly erodes material from the sample surface and ultimately allows one to determine the concentrations of elements in the sample as a function of depth below its surface.

The GD-AES system at Western Kentucky University (WKU) is a model SA-2000 manufactured by the LECO Corporation. It consists of three fundamental components: a glow-discharge excitation source, an optical polychrometer, and a computerized data acquisition system.

The excitation source is a Grimm-type glow-discharge lamp which is shown in a cross-sectional view in Figure 1.  The sample is placed on the front surface of the lamp creating an enclosed region which is first evacuated and then filled with a low pressure (1 to 5 Torr) of argon gas. An argon plasma is formed in this region by applying a potential difference across the anode and the sample, which becomes the cathode.


Figure 1 - Grimm Glow-Discharge Lamp Schematic

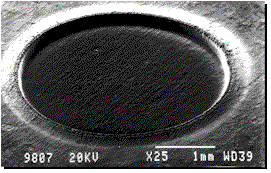
The continuous impacts of the energetic argon ions on the sample surface cause atoms to be sputtered, or removed, from the surface effectively layer by layer.  The electron micrograph in Figure 2 shows the very uniform sputter spot that is created on a sample from GD-AES analysis.
gdsburn.gif (16580 bytes)

Figure 2 - Typical GD-AES Sputter Spot

As the sputtering process proceeds to erode the sample surface, to depths of several microns, the intensities of atomic emissions are continuously monitored as a function of time. The atomic emissions from the excited sputtered atoms provide a fingerprint of the elemental composition of the material at the current sputtered depth. As depicted in Figure 3, the atomic emissions from the sputtered atoms are focused onto the entrance slit of a multi-channel spectrometer system. This spectrometer consists of a fixed diffraction grating and 28 photomultiplier tubes placed on a 0.4 m Rowland circle. The output signal of each photomultiplier tube corresponds to the intensity of emission from a particular element.


Figure 3 - Schematic Diagram of Spectrometer System


The raw data supplied by a GD-AES system consists of intensities of atomic emissions from sputtered atoms as a function of time. An example of this type of data, called a qualitative depth profile, is shown in Figure 4.  This analysis was performed on a computer hard disk platter.  The qualitative intensity versus time data clearly shows the general features of the sample: a Cobolt top layer, followed by a Nickel and Phosphorus layer, and finally an Aluminum substrate.


Figure 4 - Qualititive Depth Profile of a Computer Hard Disk Platter

When the system has been calibrated using standard reference materials that have certified values of elemental concentrations, the raw intensity versus time data can be converted to elemental concentrations versus depth into the material. This conversion process is called obtaining a quantitative depth profile (QDP). The QDP analysis of the computer hard disk is shown in Figure 5. 


Figure 5 - Quantitative Depth Profile (QDP) of a Computer Hard Disk Platter

advantage.jpg (11399 bytes)

Perhaps one of the greatest advantages of GD-AES analysis is that it can often be used to anlayze samples at depths not accessible to any other surface analysis technique.  It has the capability to detect with excellent depth resolution features in a layered sample that may be several microns below the surface of the sample.  An additional advantage is that GD-AES analysis can often be accomplished in only a few minutes time - once the system has been properly calibrated.  Finally, calibration of a GD-AES system is very straightforward and can easily be accomplished with available homogeneous bulk standard reference materials. 


The GD-AES system at Western Kentucky University has interchangeable DC and RF glow discharge lamps. Use of the DC lamp allows analysis of conducting samples in either bulk analysis or quantitative depth profile modes. The RF lamp is used to analyze non-conducting samples. Currently, quantification of the raw intensities versus time data provided by the RF system is not possible.

The elements which may be detected by a GD-AES system are determined by the type of spectrometer on the system. The LECO SA-2000 uses a 0.4m visible spectrometer with a 2400 line/mm holographic diffraction grating in a Paschen-Runge mount. The elements shown in blue and in red in the periodic chart in Figure 6 can be detected on a typical SA-2000 system. Practical considerations, such as space for detectors on the Rowland circle and the number of available digital signal processing channels, limit the number of output channels (on a SA-2000) to between 24 and 28. The twenty-six elements available on the WKU SA-2000 are shown in red.


Figure 6 - Elemental Detection Capabilities of the WKU SA-2000


When a sample is analyzed using GD-AES it becomes the cathode of the glow discharge lamp and must form a tight vacuum seal between the lamp and the atmosphere. Therefore, samples must be flat and large enough to cover the o-ring on the face of the lamp. The minimum sample size is approximately 0.5" (~12 cm) in diameter. An ideal size sample, which would allow for many analyses, would be approximately 2" x 2" (25 x 25 cm). Sample thickness can range from very thin to approximately 1.5" (~35 cm). Sample preparation facilities are available at WKU for preparing especially small or large samples for analysis. These facilities include large and small cut-off saws, a grinder/polisher, and a mounting press.

The GD-AES system at Western Kentucky University is currently being used by faculty in the Department of Physics and Astronomy and the Department of Chemistry on a variety of projects including the analysis of nitrocarborized steels, analysis of raw steels used in the tool and die industry, analysis of pressed pellets of powdered samples, and analysis of space-exposed materials from the NASA Long-Duration Exposure Facility (LDEF).


WKU Surface Analysis Laboratory Home Page

GD-AES  |  Research Project  |  Sample Preparation  |  Student Employment  |  Contact Information


This web was last modified on Friday, August 13, 1999 at 09:13 AM
by Doug Harper.