Research Overview
Steven Gibson, Western Kentucky University
The stars that light up the visible universe are each condensed from clouds of
hydrogen gas and other trace elements within their host galaxies. This process
is ongoing but mysterious: how can ambient interstellar matter -- more
tenuous than any vacuum we can create in an Earthly laboratory -- become
concentrated enough for its own gravity to pull it together into stars? To
answer that question, we need to observe this transition, which probably begins
in cold diffuse clouds (CDCs) whose free atoms are moving just slowly enough to
start joining together as molecules. CDCs are largely invisible to the human
eye but can be detected with radio and infrared telescopes. However, they are
less conspicuous than other types of interstellar clouds; their cold atoms and
still-forming molecules radiate so weakly that they are sometimes called "dark
gas". To identify CDCs and determine their properties and origins, we must
find ways to bring them out of the shadows.
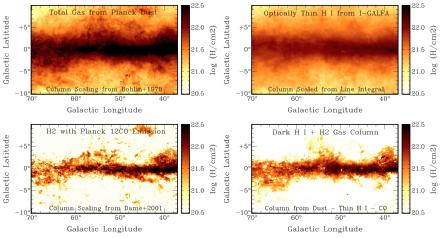
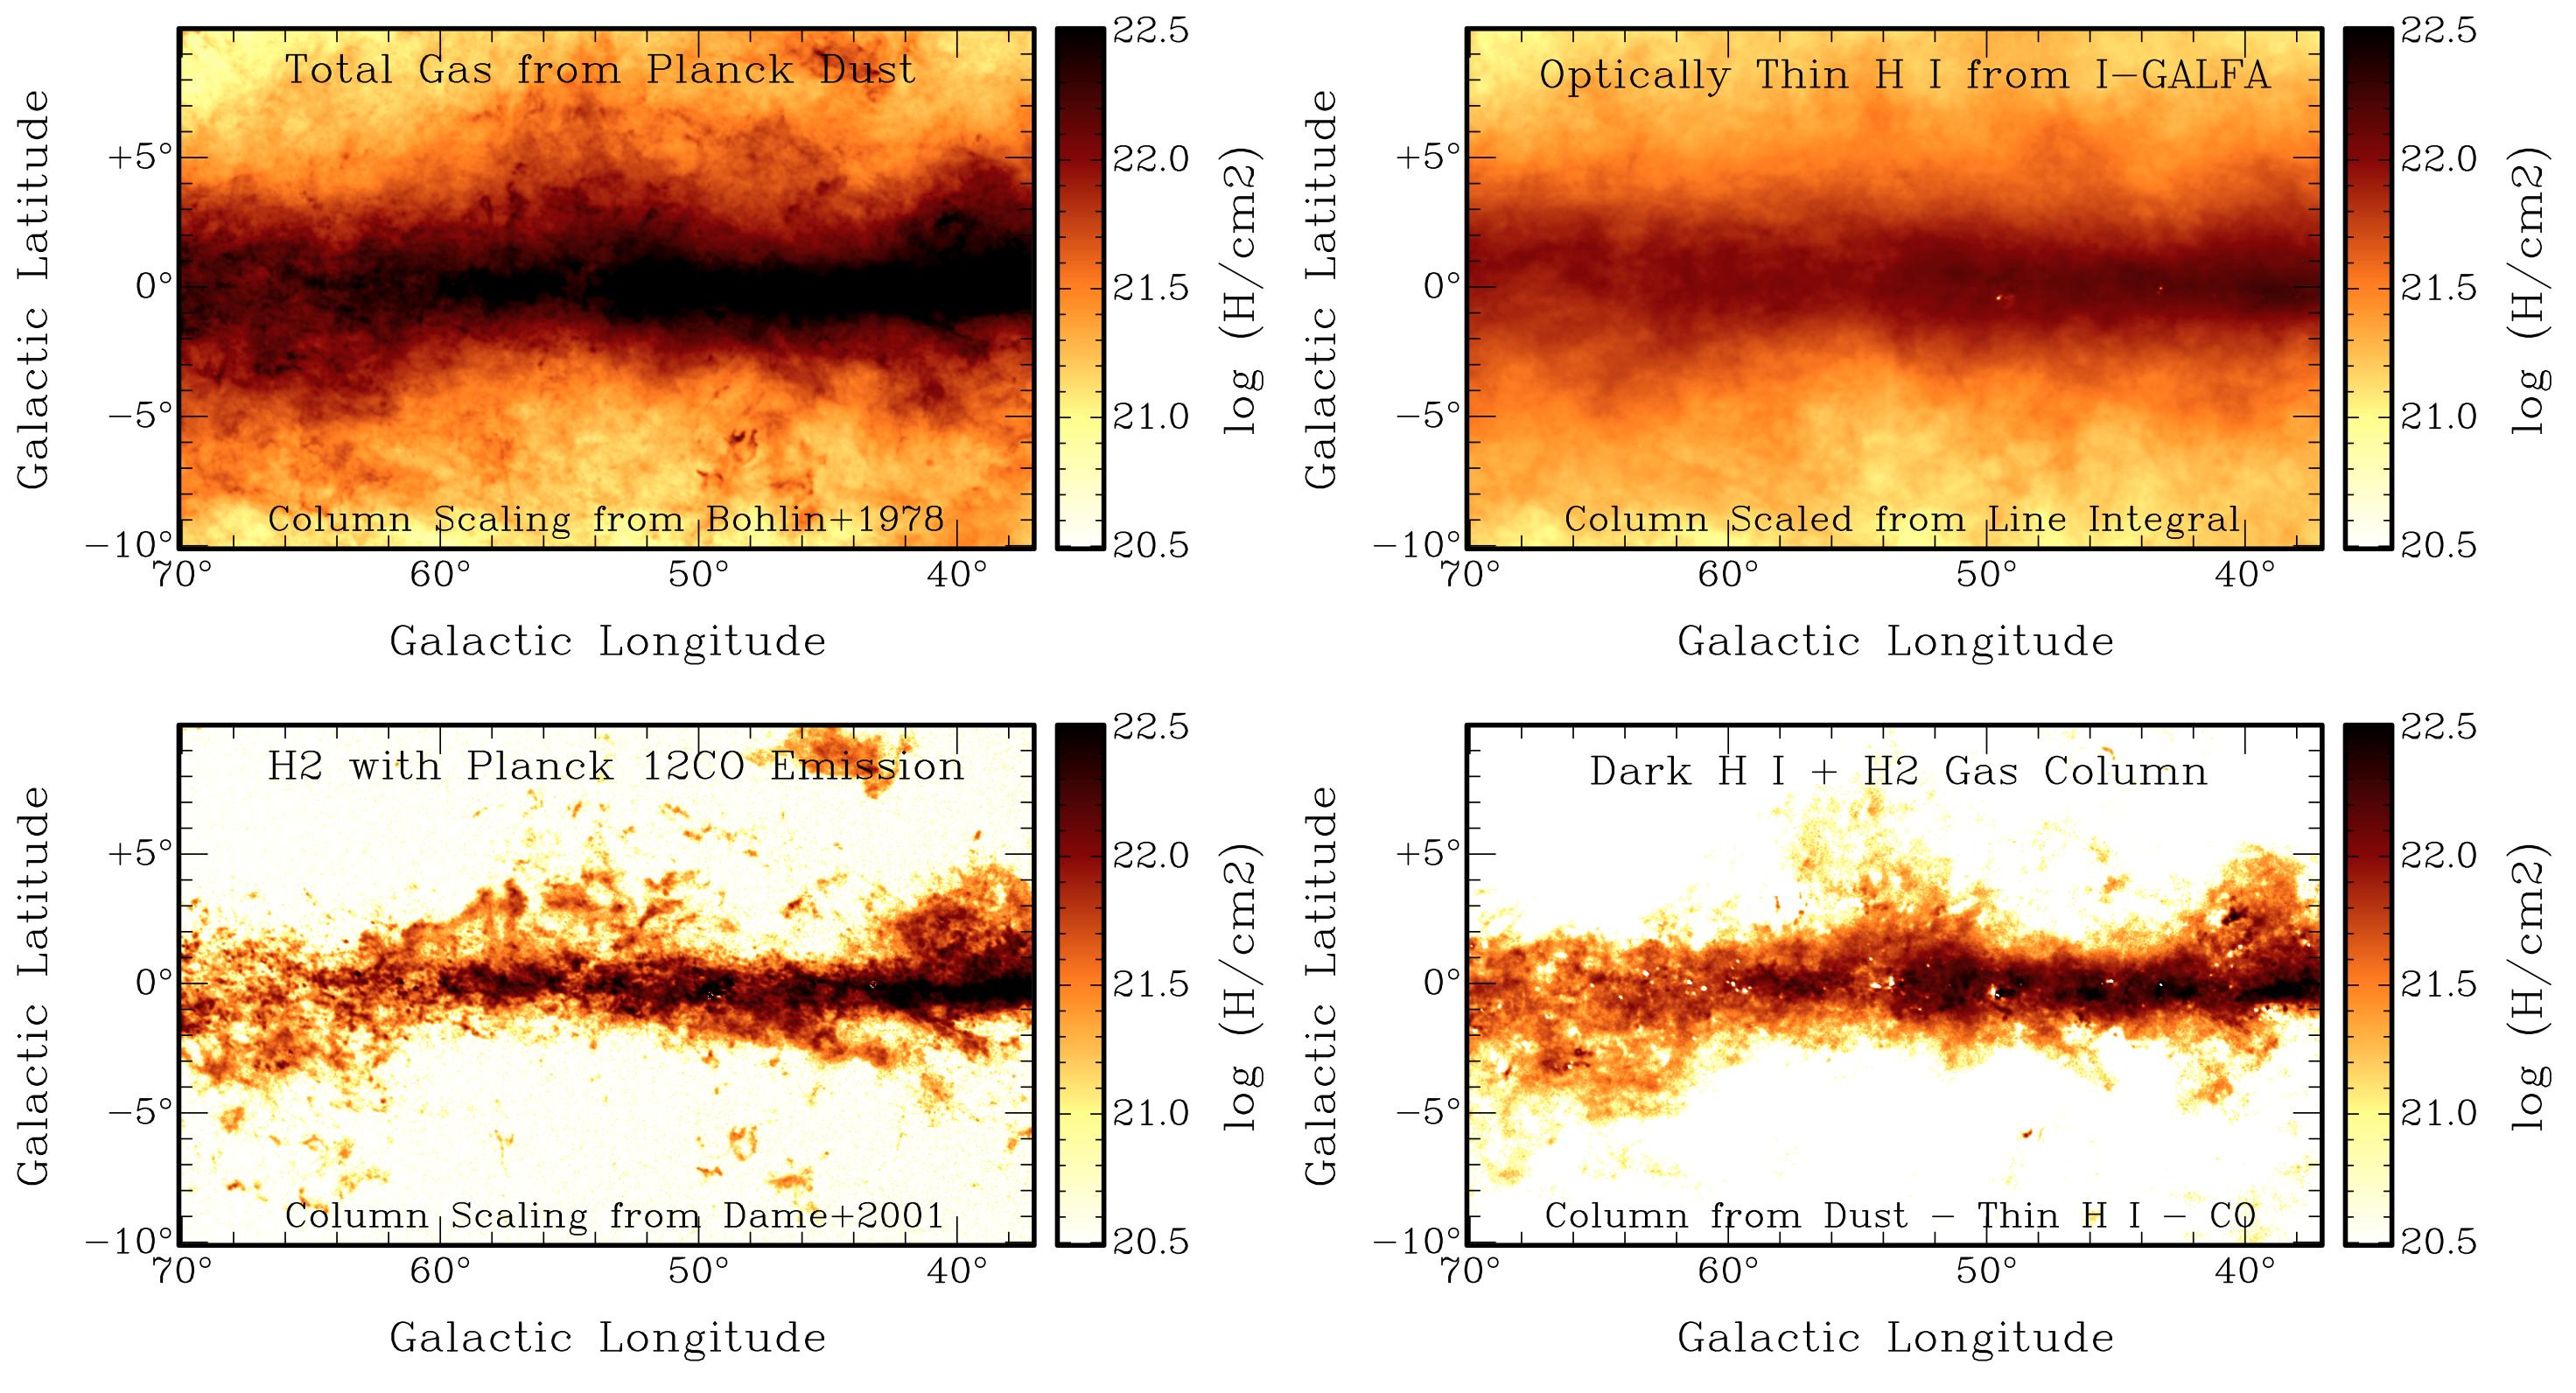
Figure 1:
Interstellar matter observed in one section of the Galaxy, including total mass from dust infrared heat radiation, neutral atomic hydrogen from radio spectroscopy, molecules from shorter-wavelength radio waves, and "dark gas" implied by the difference between the dust and the other two.
|
At Western Kentucky University, we have assembled a large body of radio and
infrared survey data covering much of our home Galaxy, applying novel analysis
methods to uncover populations of cold interstellar clouds and to assess their
physical stages of development. These surveys focus on areas near the plane of
the Galactic disk, where the majority of suitable interstellar material is
found. CDCs should contain mixtures of neutral atoms and simple molecules that
are normally observed with radio spectroscopy of neutral atomic hydrogen (HI)
and carbon monoxide (CO) emission lines at wavelengths of 21 centimeters and
2.6 millimeters, respectively. In addition, about 1% of the cloud mass is in
small, solid "dust" particles that absorb starlight, heat up, and glow at
infrared wavelengths. With some care, the dust emission can be used to track
the total amount of material present in the clouds, including any dark gas not
evident in HI and CO emission maps (Figure 1).
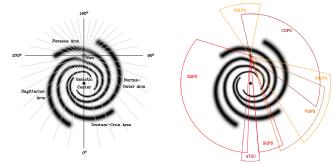
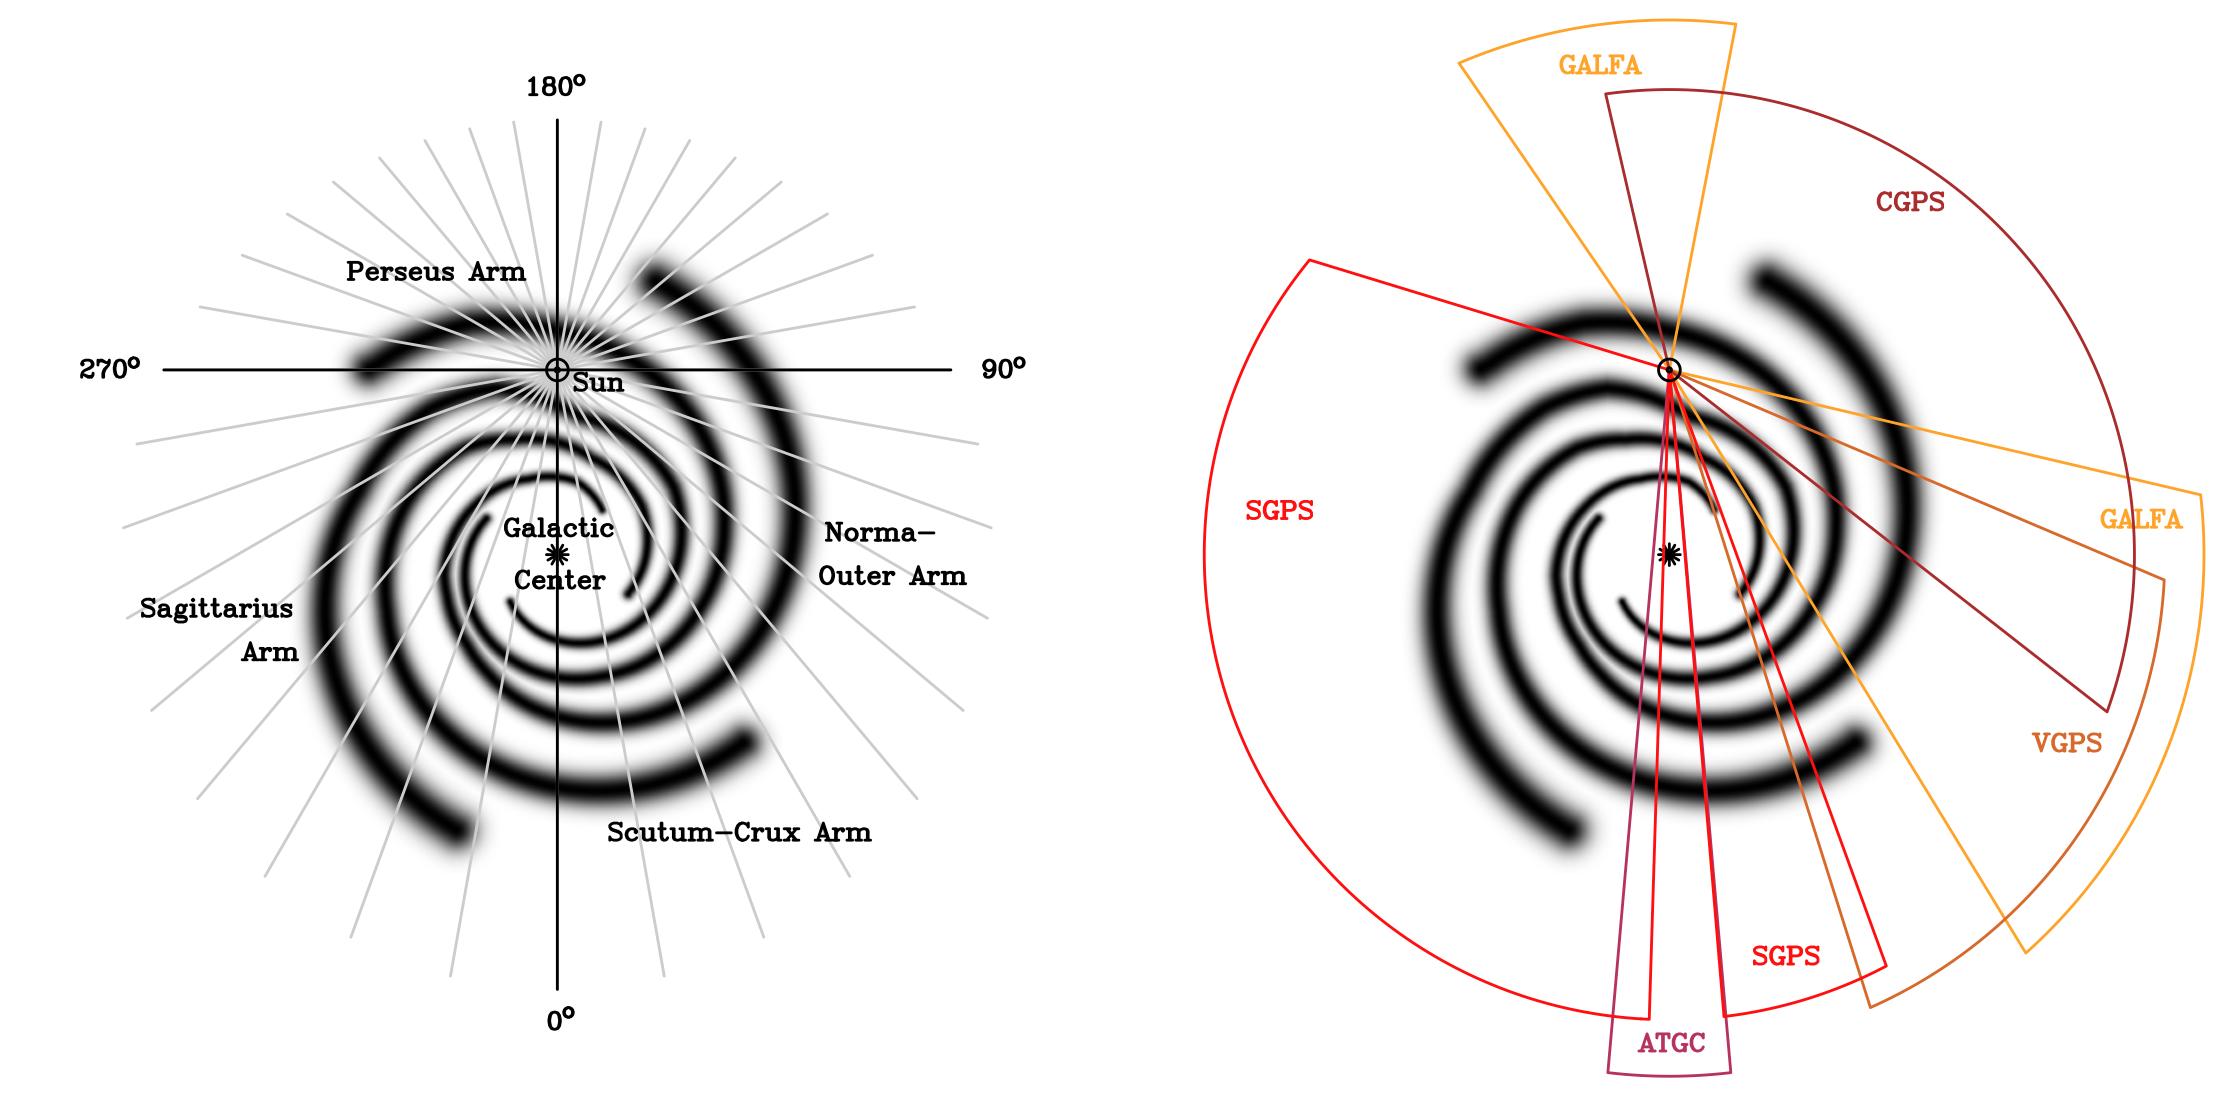
Figure 2:
Face-on view of a model of our Galaxy's spiral arms, where most star formation occurs. Left: Major arms and lines of sight from Earth corresponding to Galactic longitudes. We are 25,000 light years from the center. Right: Detailed radio surveys of neutral atomic hydrogen gas.
|
We use several HI surveys covering most of the Galactic plane region: the
Canadian, Very Large Array, and Southern Galactic Plane Surveys, the Australia
Telescope Galactic Center survey, and the Galactic Arecibo L-band Feed Array
survey (CGPS, VGPS, SGPS, ATGC, and GALFA; Figure 2). CO spectral
data were taken from the original and extended Outer Galaxy Surveys, the
Galactic Ring Survey, the University of Massachusetts-Stony Brook survey, and
the Harvard-Smithsonian Center for Astrophysics composite survey (OGS, EOGS,
GRS, UMSB, and CfA). Dust emission maps were obtained from the
Infrared Astronomical Satellite (IRAS) and Planck all-sky
surveys, with the latter also providing supplementary CO maps.
The cold and dark atomic gas in many CDCs should appear as HI self-absorption
(HISA) against warmer, brighter HI emission behind them (Figure 3).
HISA features look similar to denser molecular clouds, and some have matching
CO emission; others may have dark molecular gas in which CO is still forming.
Searching through the HI surveys noted above, we find HISA wherever backgrounds
are bright enough to absorb against, but with enhancements where gas is
predicted to pile up in spiral arms prior to new star formation
(Figure 4). We also find that HISA positions are more likely to
have CO in the inner parts of the Galaxy than in areas outside the Sun's orbit,
but when chance cloud alignments are accounted for, most HISA lacks matching
CO, regardless of location (Figure 5). This suggests we are
capturing different stages of cloud evolution, but how can we tell if dark
molecular gas is present or not?
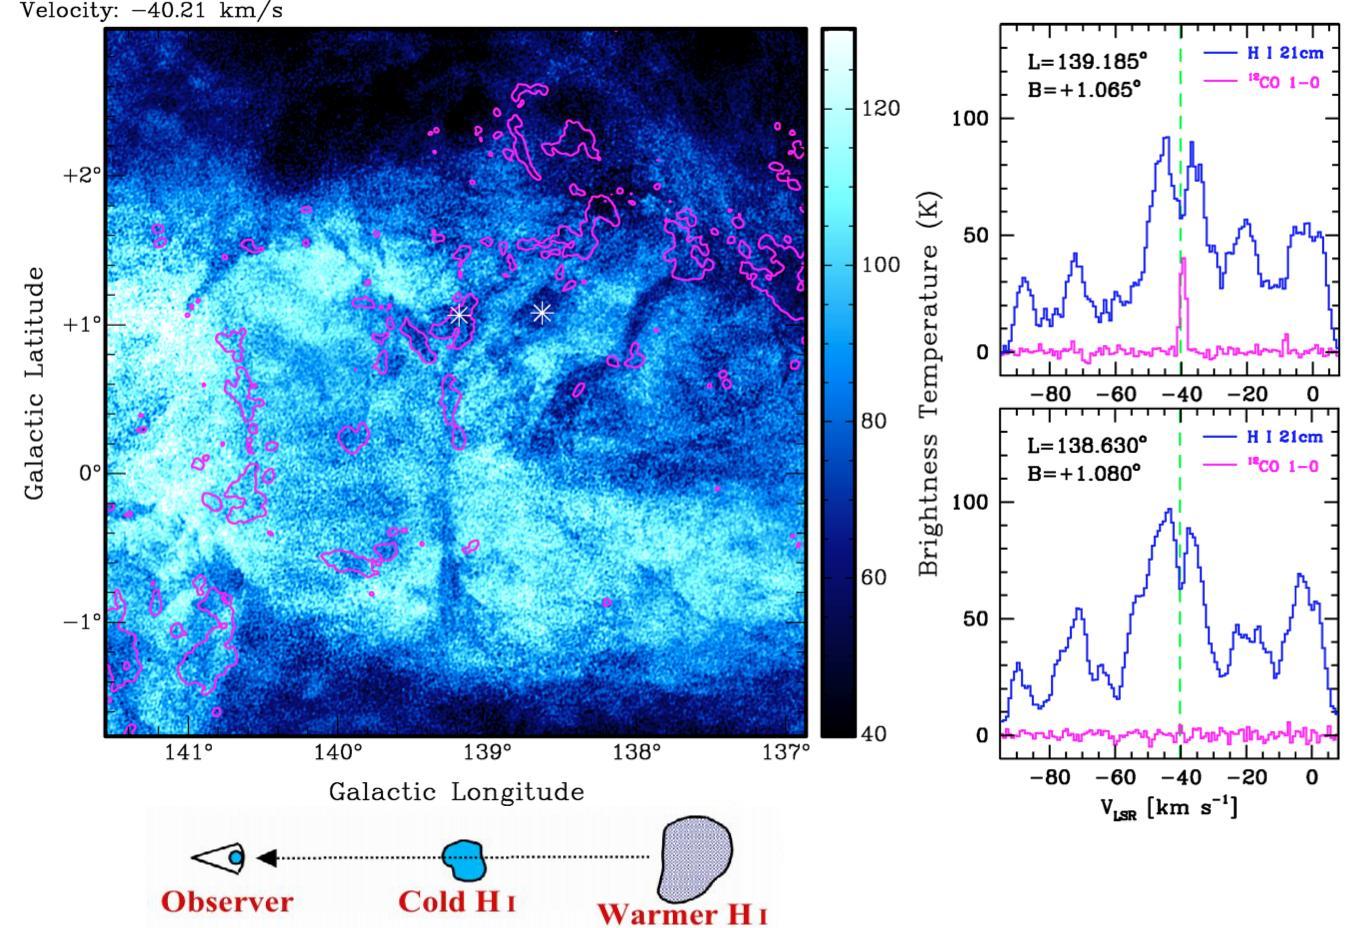
Figure 3:
Neutral atomic hydrogen (HI) line emission (blue) with carbon monoxide (CO) molecular emission (magenta contours) in a map (left) and in spectra (right) from the marked positions. Drops in HI brightness are HI self-absorption (HISA) from cold HI in front of warmer HI emission (bottom).
|
|
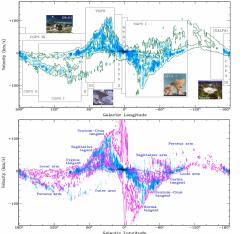
Figure 4:
HISA found across the Galactic disk using the surveys in Figure 1 and extracted with custom software (GALFA data pending). HISA detections are plotted vs. longitude and Doppler velocity, which relates to position in the Galaxy; contours are bright HI emission (green) and CO (magenta).
|
|
Figure 5:
Fraction of HISA clouds containing measurable CO, plotted vs. longitude and for velocity ranges corresponding to different parts of the Galaxy. Colors are for different HI surveys. Most HISA clouds have no apparent CO, but many may still have significant dark molecular gas.
|
|
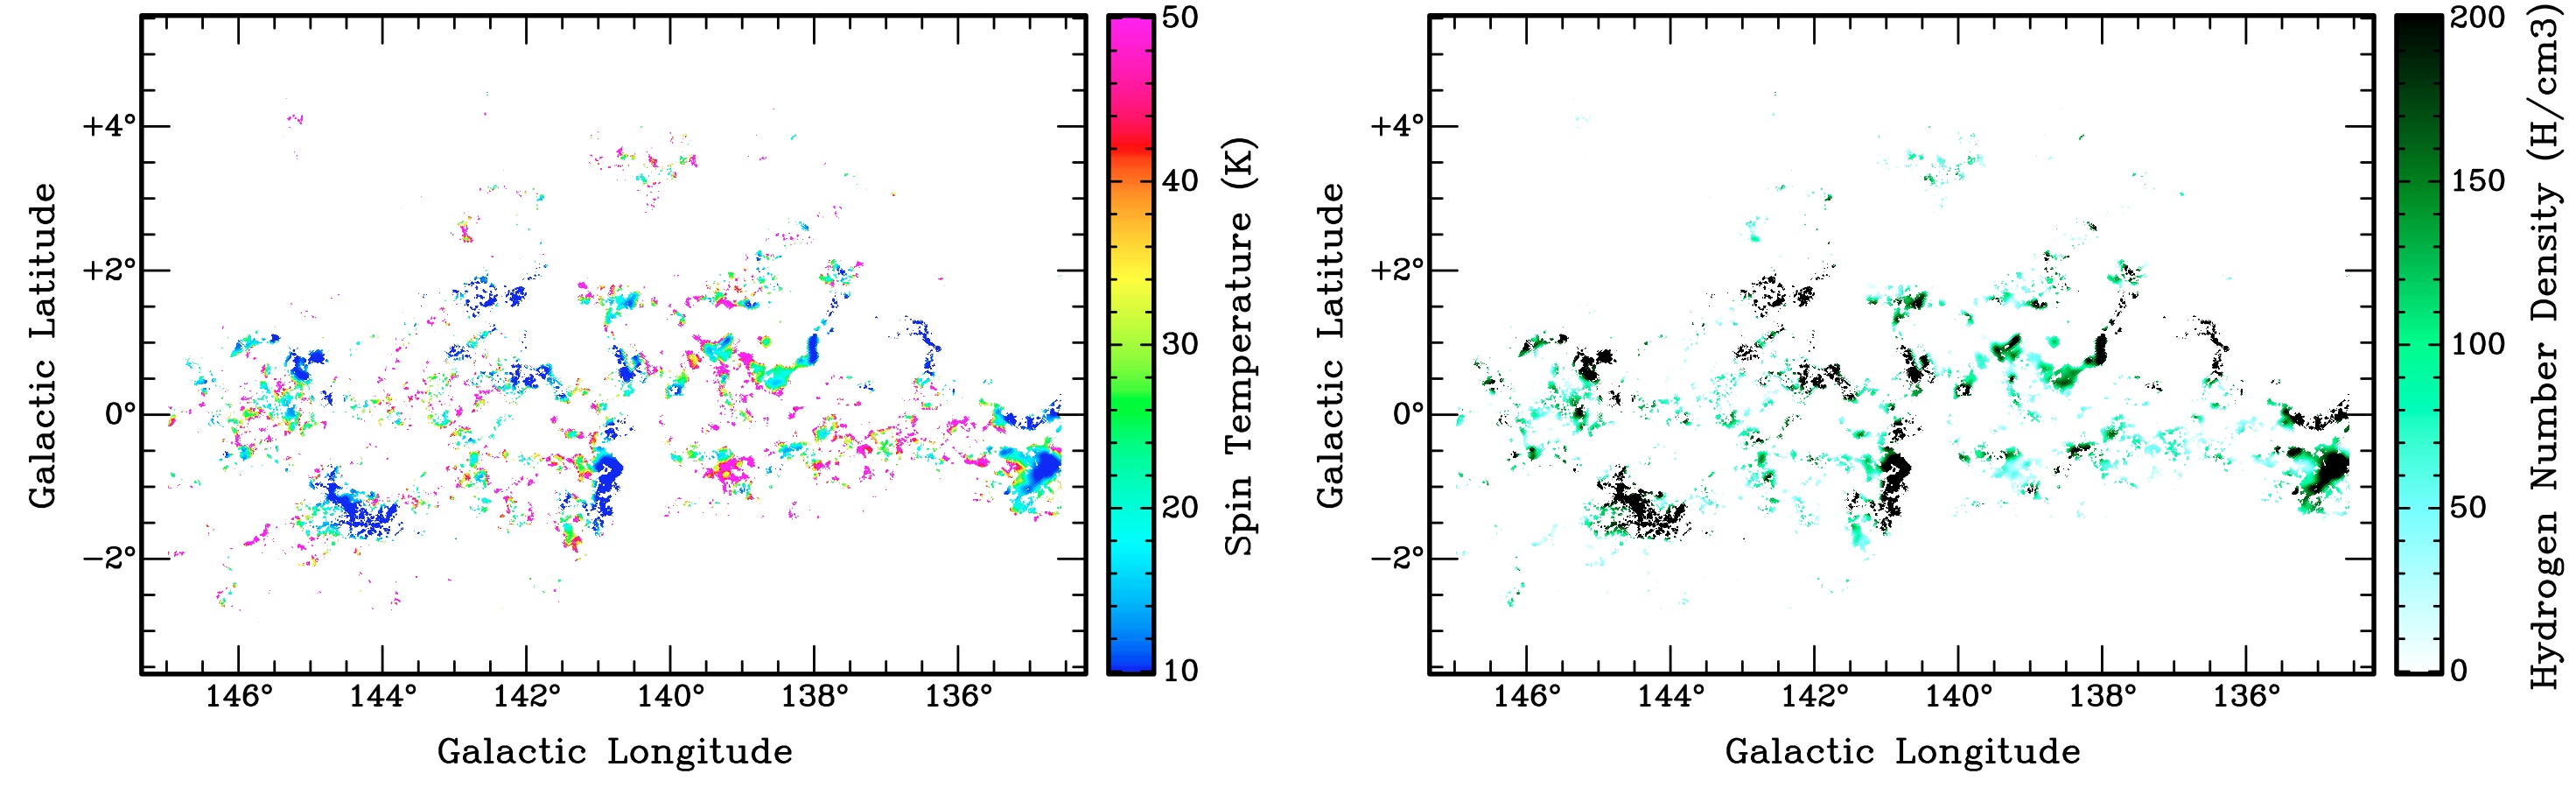
To decide such issues, we developed a new method to map HISA cloud
properties via combined analysis of the gas and dust data, finding
temperatures, densities, and atomic/molecular mixes in the ranges expected for
clouds making this transition, with significant amounts of dark atomic and dark
molecular gas both present (Figure 6). In parallel, we devised a
new way to identify CDCs without bright HI backgrounds from their HI emission
line shapes and analyze them with CO and dust data in the same manner as HISA
features to map their properties. These combined approaches present a picture
of CDCs as indeed the probable stepping stones between ambient interstellar
material and star-forming molecular clouds.
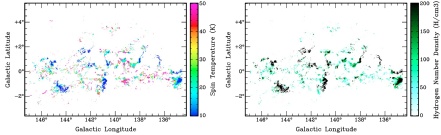
Figure 6:
Maps of gas temperature (left) and density (right) vs. location in a number of HISA clouds stretching over a 1500-light-year section of the Perseus spiral arm, determined from combined analysis of the HISA features, CO images, and dust emission.
|
The initial analysis of the cloud dust content was somewhat simplistic, but
we have subsequently pursued more detailed investigations fitting the dust
infrared emission with models over a broad range of wavelengths for improved
constraints on the cloud properties, which shows great promise
(Figure 7).
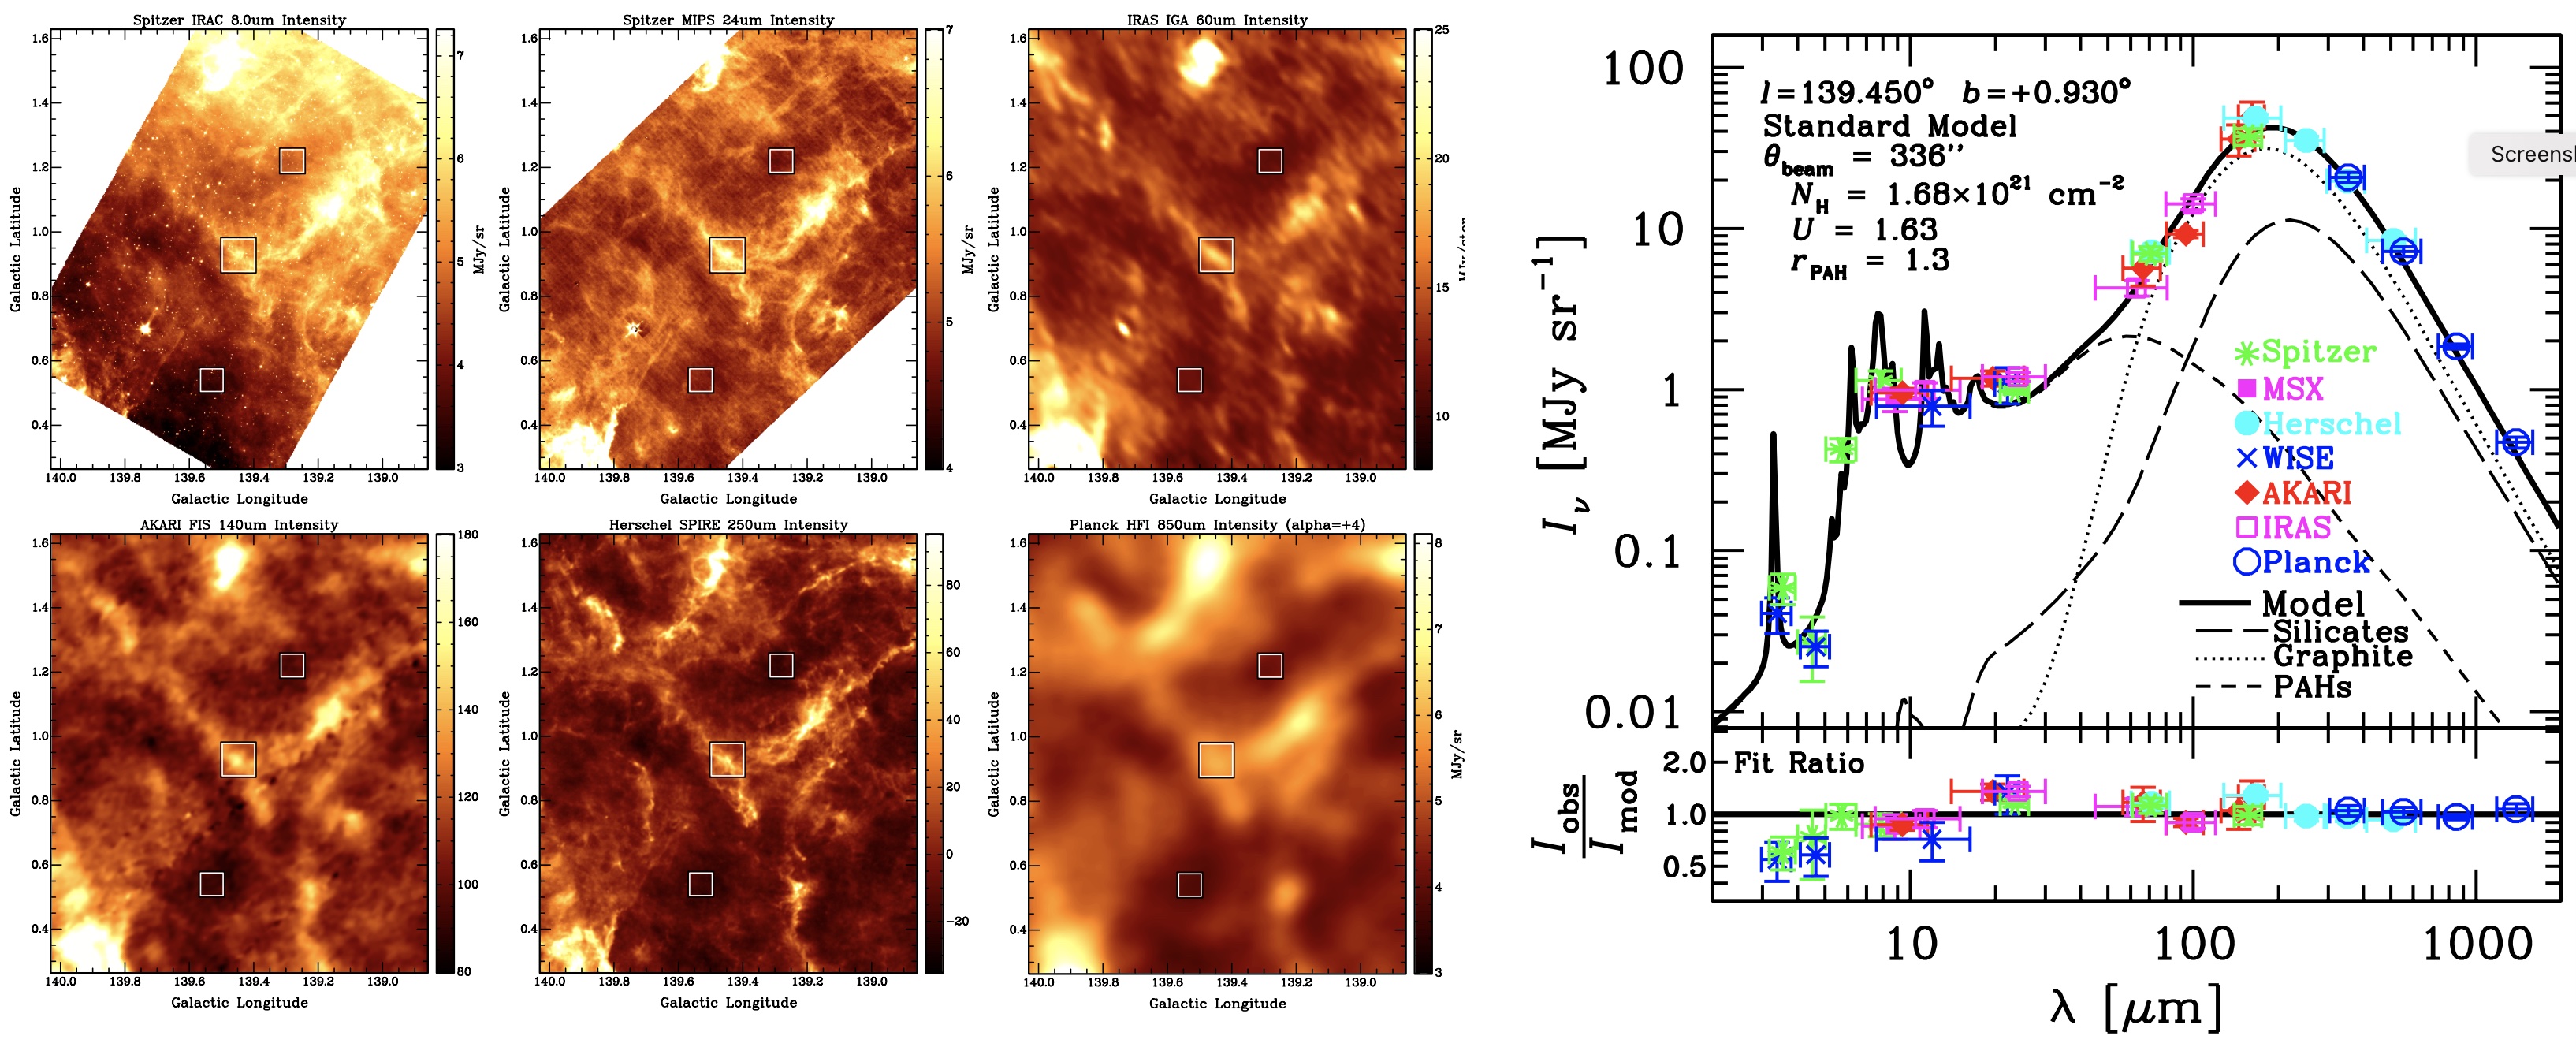
Figure 7: Infrared dust emission of the clouds
in Figure 3.
Left: images at wavelengths of 8, 24, 60, 140, 250, and 850 microns
from Spitzer, IRAS, AKARI, Herschel, and
Planck prior to background emission subtraction; ON and OFF photometry
boxes are marked.
Right: Spectral energy distribution (SED) at the cloud center from all
available survey bands, including WISE and MSX. Vertical bars
indicate photometric uncertainties; horizontal bars mark the wavelength range of
each band. The curves show a trial fit of the Li & Draine (2001) emission
model and grain component contributions. The lower plot gives fit ratios as
residuals.
|
Products of this work, including maps and analysis tools, will be made
publicly available in support of future Galactic survey efforts. This research
program has also helped a number of
students prepare for scientific and technical careers by giving them real
research experience while enrolled at a comprehensive, teaching-intensive, and
primarily undergraduate institution in an economically disadvantaged region of
the United States. WKU students presented over two
dozen talks and posters on different aspects of the
work at local, regional, and national conferences, winning awards at each
level. A total of 10 students have been actively involved in this research,
with 5 pursuing subsequent graduate studies.
Complementing these research efforts with professional facilities and surveys
around the world, we have pursued parallel development
of local radio astronomy facilities where students can
gain real hands-on experience that will help them prepare for scientific and
technical careers. This began with Radio JOVE but
has branched out into other areas, including a 10-foot
dish telescope under current development.
Steven Gibson